


Governor's Cup Wins in a Row
(Site Selection)
Barneston has a population of 114. It is located 23.5 miles south of Beatrice on Highway 77.
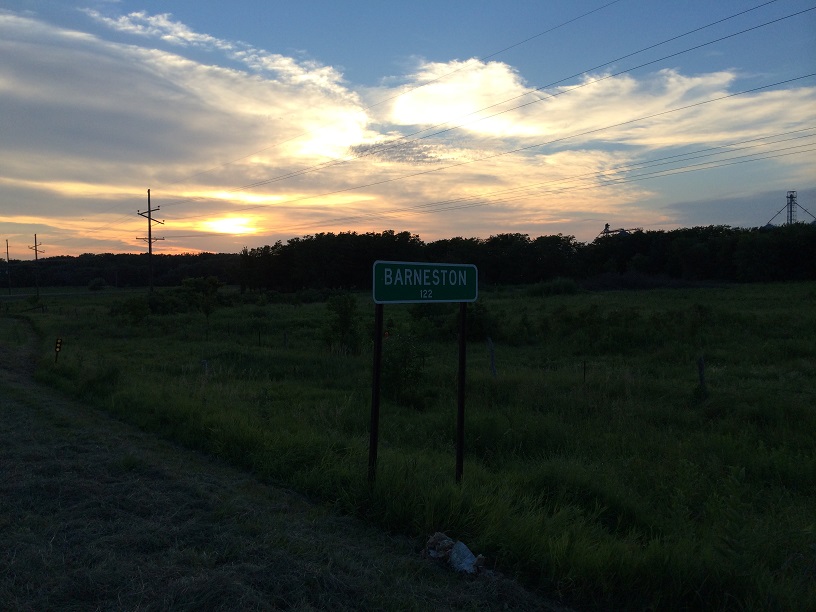
For more detailed information, please click here
| Population | 2000 | 2010 | 2023 | 2028 |
|---|---|---|---|---|
| Barneston, NE | 111 | 99 | 100 | 95 |
Source: ESRI, 2023-10-17
| Population | 2010 | 2023 | 2028 |
|---|---|---|---|
| 0-4 | 6 | 4 | 4 |
| 5-9 | 5 | 8 | 5 |
| 10-14 | 7 | 3 | 3 |
| 15-19 | 6 | 6 | 10 |
| 20-24 | 3 | 4 | 3 |
| 25-29 | 4 | 9 | 7 |
| 30-34 | 4 | 5 | 4 |
| 35-39 | 5 | 5 | 4 |
| 40-44 | 6 | 7 | 5 |
| 45-49 | 8 | 11 | 3 |
| 50-54 | 8 | 9 | 4 |
| 55-59 | 8 | 5 | 5 |
| 60-64 | 7 | 5 | 8 |
| 65-69 | 4 | 5 | 11 |
| 70-74 | 4 | 5 | 8 |
| 75-79 | 4 | 4 | 7 |
| 80-84 | 3 | 2 | 3 |
| 85+ | 4 | 3 | 1 |
| 18+ | 76 | 83 | 78 |
| Median Age | 46 | 44 | 49 |
Source: ESRI, 2023-10-17
| Barneston, NE | 2023 |
|---|---|
| Total | 100.00 |
| White Alone | 93.00 |
| Black Alone | 0.00 |
| American Indian Alone | 0.00 |
| Asian Alone | 0.00 |
| Pacific Islander Alone | 0.00 |
| Some Other Race | 1.00 |
| Two or More Races | 6.00 |
| Hispanic Origin | 1.00 |
| Diversity Index | 14.90 |
Source: ESRI, 2023-10-17
| Barneston, NE | 2023 - 2028 |
|---|---|
| Population | -1.02% |
| Households | -1.14% |
| Families | 1.68% |
| Median Household Income | 1% |
| Per Capita Income | 1% |
Source: ESRI, 2023-10-17
Back To Top| Population | 2000 | 2010 | 2023 | 2028 |
|---|---|---|---|---|
| Households | 46 | 42 | 36 | 34 |
| Housing Units | 56 | 55 | 51 | 48 |
| Owner Occupied Units | 30 | 31 | ||
| Renter Occupied Units | 6 | 3 | ||
| Vacant Units | 15 | 14 |
Source: ESRI, 2023-10-17
| Barneston, NE | 2023 | 2028 |
|---|---|---|
| Median Home Value | $83,333 | $137,500 |
| Average Home Value | $215,833 | $244,355 |
| <$50,000 | 11 | 10 |
| $50,000 - $99,999 | 6 | 4 |
| $100,000 - $149,999 | 3 | 2 |
| $150,000 - $199,999 | 4 | 5 |
| $200,000 - $249,999 | 0 | 2 |
| $250,000 - $299,999 | 3 | 4 |
| $300,000 - $399,999 | 1 | 1 |
| $400,000 - $499,999 | 0 | 0 |
| $500,000 - $749,999 | 0 | 0 |
| $1,000,000 + | 1 | 0 |
Source: ESRI, 2023-10-17
| Year Range | Houses Built |
|---|---|
| 2010 or Later | 1 |
| 2000-2009 | 3 |
| 1990-1999 | 3 |
| 1980-1989 | 2 |
| 1970-1979 | 5 |
| 1960-1969 | 3 |
| 1950-1959 | 4 |
| 1940-1949 | 2 |
| 1939 or Before | 30 |
Source: ESRI, 2023-10-17
Back To Top| Barneston, NE | 2023 | 2028 |
|---|---|---|
| Median Household | $62,920 | $65,004 |
| Average Household | $75,083 | $79,563 |
| Per Capita | $27,030 | $28,475 |
Source: ESRI, 2023-10-17
| Barneston, NE | 2023 |
|---|---|
| <$15,000 | 4 |
| $15,000 - $24,999 | 2 |
| $25,000 - $34,999 | 3 |
| $35,000 - $49,999 | 6 |
| $50,000 - $74,999 | 5 |
| $75,000 - $99,999 | 6 |
| $100,000 - $149,999 | 8 |
| $150,000 - $199,999 | 1 |
| $200,000+ | 1 |
Source: ESRI, 2023-10-17
Back To Top| Category | Commuters |
|---|---|
| Workers 16+ | 53 |
| In-County Residents | 38 |
| Out-of-County Residents | 7 |
| Drive Alone | 44 |
| Carpooled | 5 |
| Public Transport | 0 |
| Work at Home | 1 |
| Less than 5 minutes | 7 |
| 5-9 minutes | 6 |
| 10-14 minutes | 2 |
| 15-19 minutes | 3 |
| 20-24 minutes | 8 |
| 25-29 minutes | 5 |
| 30-34 minutes | 13 |
| 35-39 minutes | 1 |
| 40-44 minutes | 0 |
| 45-59 minutes | 3 |
| 60-89 minutes | 3 |
| 90+ minutes | 2 |
| Average Travel Time | 26 |
Source: ESRI, 2023-10-17
Source: ESRI, 2023-10-17
| Category | Number |
|---|---|
| Total Employees | 18 |
| Agr/Forestry/Fish/Hunt | 0 |
| Mining | 0 |
| Utilities | 5 |
| Construction | 0 |
| Manufacturing | 0 |
| Wholesale Trade | 3 |
| Retail Trade | 0 |
| Motor Veh/Parts Dealers | 0 |
| Furn & Home Furnish Str | 0 |
| Electronics & Appl Store | 0 |
| Bldg Matl/Garden Equip | 0 |
| Food & Beverage Stores | 0 |
| Health/Pers Care Stores | 0 |
| Gasoline Stations | 0 |
| Clothing/Accessory Store | 0 |
| Sports/Hobby/Book/Music | 0 |
| General Merchandise Str | 0 |
| Misc Store Retailers | 0 |
| Nonstore Retailers | 0 |
| Transportation/Warehouse | 1 |
| Information | 0 |
| Finance & Insurance | 0 |
| Cntrl Bank/Crdt Intrmdtn | 0 |
| Sec/Cmdty Cntrct/Oth Inv | 0 |
| Insur/Funds/Trusts/Other | 0 |
| Real Estate/Rent/Leasing | 0 |
| Prof/Scientific/Tech Srv | 0 |
| Legal Services | 0 |
| Mgmt of Comp/Enterprises | 0 |
| Admin/Support/Waste Mgmt | 0 |
| Educational Services | 0 |
| HealthCare/Social Assist | 0 |
| Arts/Entertainment/Rec | 0 |
| Accommodation/Food Srvcs | 5 |
| Accommodation | 0 |
| Food Srv/Drinking Places | 5 |
| Other Srv excl Pub Admin | 2 |
| Auto Repair/Maintenance | 0 |
| Public Administration Emp | 2 |
Source: ESRI, 2023-10-17
| Barneston, NE | 2023 |
|---|---|
| Some High School | 5 |
| Graduated High School | 28 |
| Associates Degree | 9 |
| Bachelor's Degree | 3 |
| Graduate Degree | 1 |
Source: ESRI, 2023-10-17
Back To Top| Category | Number |
|---|---|
| Total Businesses | 7 |
| Agr/Forestry/Fish/Hunt Bus | 0 |
| Mining Bus | 0 |
| Utilities Bus | 1 |
| Construction Bus | 0 |
| Manufacturing Bus | 0 |
| Wholesale Trade Bus | 1 |
| Retail Trade Bus | 0 |
| Motor Veh/Parts Dealers Bus | 0 |
| Furn & Home Furnish Str Bus | 0 |
| Electronics & Appl Store Bus | 0 |
| Bldg Matl/Garden Equip Bus | 0 |
| Food & Beverage Stores Bus | 0 |
| Health/Pers Care Stores Bus | 0 |
| Gasoline Stations Bus | 0 |
| Clothing/Accessory Store Bus | 0 |
| Sports/Hobby/Book/Music Bus | 0 |
| General Merchandise Str Bus | 0 |
| Misc Store Retailers Bus | 0 |
| Nonstore Retailers Bus | 0 |
| Transportation/Warehouse Bus | 1 |
| Information Bus | 0 |
| Finance & Insurance Bus | 0 |
| Cntrl Bank/Crdt Intrmdtn Bus | 0 |
| Sec/Cmdty Cntrct/Oth Inv Bus | 0 |
| Insur/Funds/Trusts/Other Bus | 0 |
| Real Estate/Rent/Leasing Bus | 0 |
| Prof/Scientific/Tech Srv Bus | 0 |
| Legal Services Bus | 0 |
| Mgmt of Comp/Enterprises Bus | 0 |
| Admin/Support/Waste Mgmt Bus | 0 |
| Educational Services Bus | 0 |
| HealthCare/Social Assist Bus | 0 |
| Arts/Entertainment/Rec Bus | 0 |
| Accommodation/Food Srvcs Bus | 1 |
| Accommodation Bus | 0 |
| Food Srv/Drinking Places Bus | 1 |
| Other Srv excl Pub Admin Bus | 2 |
| Auto Repair/Maintenance Bus | 0 |
| Public Administration Bus | 1 |
Source: ESRI, 2023-10-17
Back To Top
Governor's Cup Wins in a Row
(Site Selection)
Best States in America
(U.S. News and World Report, 2019)
Best State for Families
(WalletHub, 2020)
Best States for Veterans
(CNBC, 2020)